LAST UPDATED: 8/28/20
How to Submit an Error Report
We're grateful whenever you can give us insight into any system errors you encounter. To help our software team find and correct the problem, we need specific information about the error you're experiencing. This article will explain what we need and how you can collect that information.
When reporting an error to our software team, please provide the following 4 items:
- Step 1: Provide the URL of the page where you observe the problem.
- Step 2: Take a screenshot of any console errors which might be relevant (if there are any). If there's a lot of console information that might be relevant, please also save your console as a log file and share that log.
- Step 3: Take a screenshot of any network requests which might be relevant.
- Step 4: Copy/paste a cURL command which contains information about the erroring request (if there is one).
If you don't know what these items are, don't worry - most simply require some cutting and pasting from Chrome's DevTools. We'll walk you through everything below.
Before We Get Started: How to Preserve Text Formatting with a Backtick Block
In the directions below, you'll be asked to cut and paste technical text to our software team. To do this in a Rocket.chat message or a github message, we have to use a special technique that preserves formatting. Put your pasted text between two lines which consist only of three backticks each, like this:
```
curl 'data:image/svg+xml;base64,PHN2ZyBpZD0iYXJ0d29yayIgeG1sbnM9Imh0dHA6Ly93d3cudzMub3JnLzIwMDAvc3ZnIiB3aWR0aD0iMTQ0MCIgaGVpZ2h0PSI1MzYuOCIgdmlld0JveD0iMCAwIDE0NDAgNTM2LjgiPjxzdHlsZT4uc3Qwe3N0cm9rZS1saW5lam9pbjpyb3VuZH0uc3QwLC5zdDEsLnN0Miwuc3QzLC5zdDR7ZmlsbDpub25lO3N0cm9rZTojNzliOGZmO3N0cm9rZS13a' \
  -H 'Referer: ' \
  -H 'User-Agent: Mozilla/5.0 (X11; Linux x86_64) AppleWebKit/537.36 (KHTML, like Gecko) Chrome/84.0.4147.105 Safari/537.36' \
  --compressed
```
To find the backtick (`) key on a US keyboard, look to the left of the 1 key. It's the same key as the ~!
Step 1: Record the URL
Copy the URL of the page where you experienced a problem and paste it into a message for your software personnel (RocketChat, github, email, etc.). You don't need to preserve formatting in this step.
Next, Open Chrome's DevTools Pane
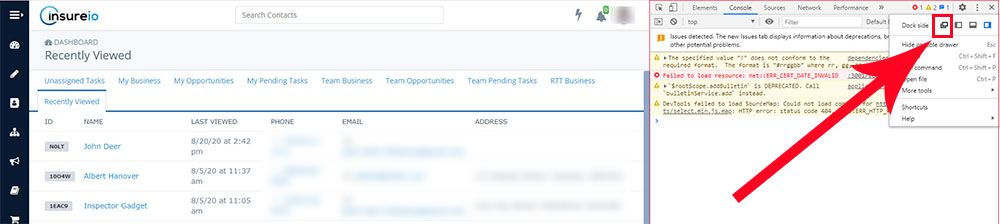
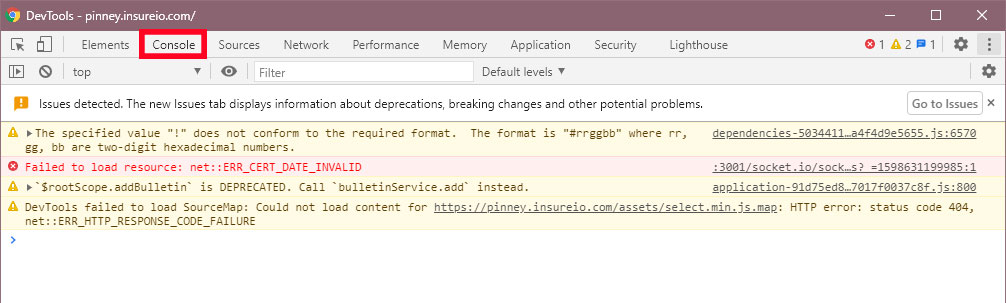
To open DevTools in Chrome, press Ctrl + Shift + J. You'll see a panel that looks like this:
You can change where this panel docks on your screen. Click the vertical three-dot menu on the top right, then select the Dock side option you prefer. The first option undocks the panel into a separate window, which may be easier to navigate. You can then resize the new window as needed.
Step 2: Save Info from the Console Pane
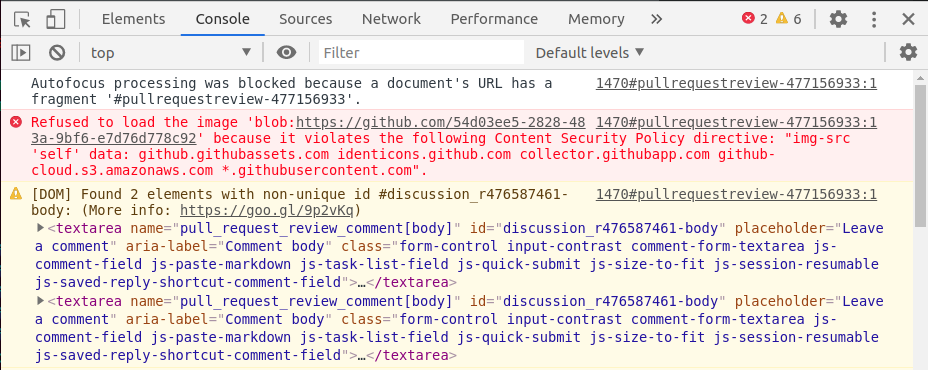
The Console tab should already be selected in your DevTools panel, as shown below.
The list of messages displayed gives you information about what's working - or not working - at the URL you're visiting. Messages with a white background provide information. Messages with a yellow background provide warnings. Messages with a red background indicate errors. If you see any red error messages, they might be related to your problem. Please screenshot them for us.
How to Save the Console Log
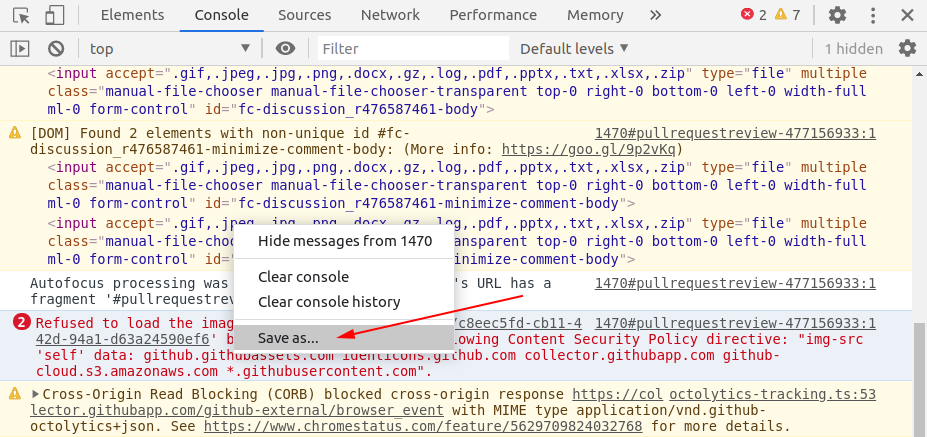
If there's a lot of information in the console (such as multiple error messages and you're not sure which ones might be important), you can save the whole thing as a .log file and send it to us. Beware, though: the .log file will lack any helpful formatting to indicate which rows are important, so we need you to indicate which rows you think are relevant. For example, you can copy and paste the text of any relevant rows and include them in your message, or summarize the issue(s) they represent ("cert_date_invalid", for example).
To save the console log to a file, right-click any one of the rows, then select Save as.... Save the file in a location you'll remember so you can attach it to your message.
Step 3: Save Info from the Network Pane
With the DevTools pane still open, click the Network tab to see all of the requests your browser has made.
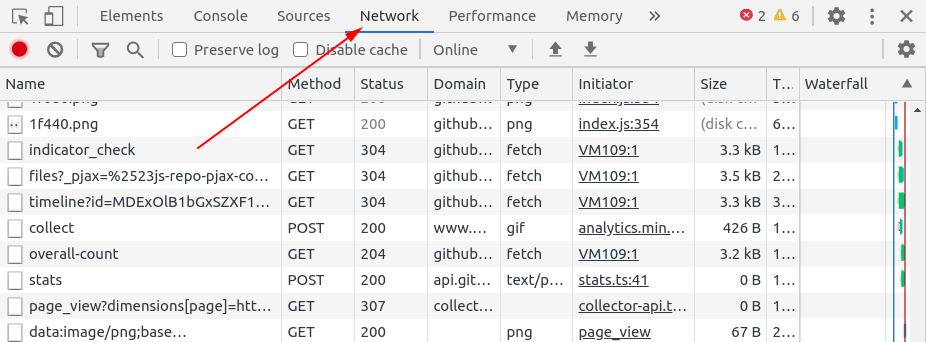
Network Pane Request Rows
In this table, each row represents one network request your browser made. It only shows requests made while the Tools pane has been open, so you may have an empty or incomplete list here. If that's the case, just refresh your page and/or repeat whatever actions led to your error, all while the Tools pane is open.
Which Rows Are Relevant to Your Error?
There's no universal answer, but one of 3 things is usually an indicator:
- The request row is red, indicating a traditional error. But there's a catch - not all error responses are related to the error you experienced. Some third-party requests routinely return errors which are not significant.
- You recognize the name of the request. For instance, the row says
involved_parties.json, and you know that you are trying to load "Involved Parties." - You watched responses arrive in your requests table, and the timing of one or more arrivals matches the error that you observe.
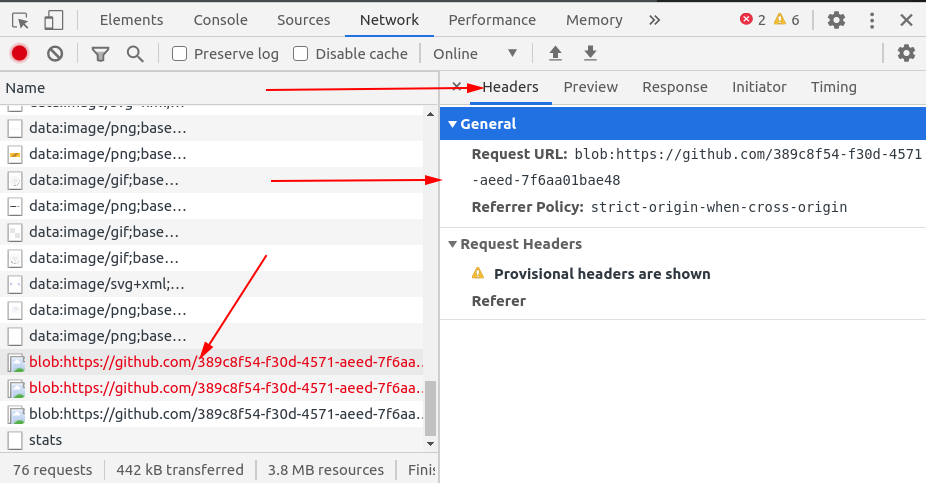
Screenshot Network Request Details
Try to identify the row you think is related to your error. Click it to make a pane of information appear on the right. By default, the Headers tab will be selected. It provides the most basic information, but it's usually longer than the pane itself, so you may have to scroll down to view the entire thing. A screenshot of this can be very helpful.
NOTE: Having trouble getting the whole thing in a screenshot? If you copy/paste a cURL command for the given request row as described in the step below, capturing more information is probably unnecessary.
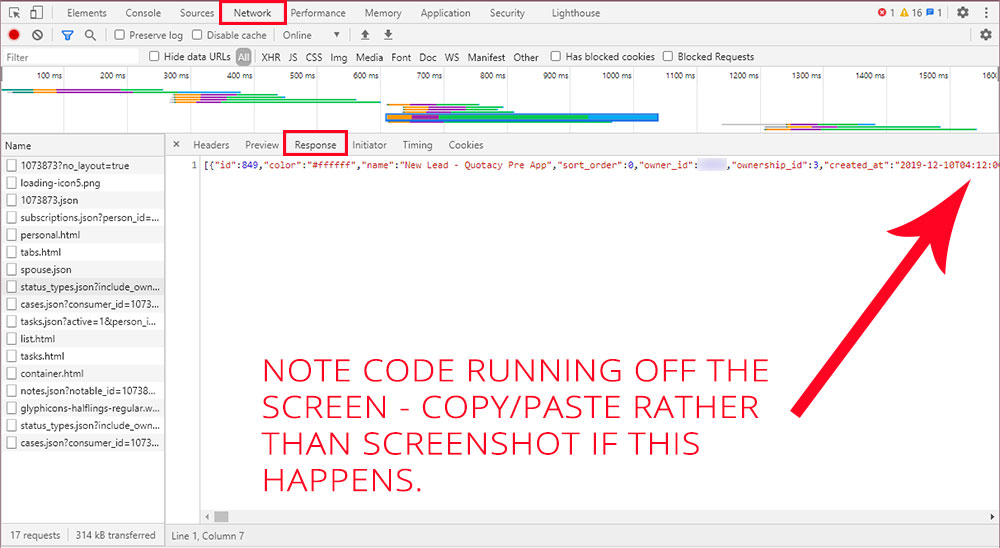
Next, click the Response tab. You can either copy-paste its contents (preserving formatting) in your message to the software team, or take a screenshot of it. Keep in mind that the code may run offscreen - if this is the case, please copy/paste.
Step 4: Copy a cURL Command
Now we need one final piece of information from the Network tab. Right-click the name of the request row you suspect is related to your error. Select Copy, then Copy as cURL.
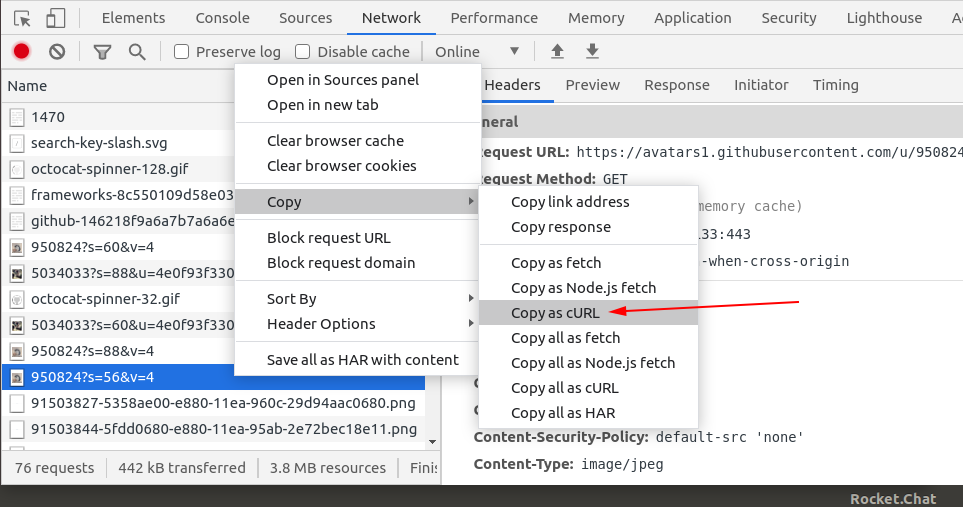
This will copy information about the request to your computer's clipboard. Please paste this into a message to your software personnel, preserving formatting using the backtick block method described above.
Thank you for taking the time to document the error you experienced. Just a few minutes of time on your end can help us find and solve the problem much faster than we could without this information. We appreciate your help in making Insureio even better!